
Customer Journey Analytics: What It Is and How to Use It (With Examples)
 George Field
— 16 min read
George Field
— 16 min read
Your dashboard says sales dipped last week. Fair enough. But which step broke? The product page, the basket, the shipping screen? A sessions chart won't say. Customer journey analytics will.
This guide is for ecommerce and SaaS teams who run on one website and have no data team. No CDP, no call-centre feeds, no Adobe contract. Just a site, steady traffic and a nagging feeling that money leaks out somewhere between the first click and the thank-you page.
Here's what you'll get: a plain definition, the handful of metrics worth your time, a six-step method you can start on Monday, three worked examples and the tools that suit a small team. Every stat links straight to the research behind it, not to some vendor's marketing page.
TL;DR
- Customer journey analytics (CJA) tracks the steps people take on your site and shows where they stall or leave.
- A handful of metrics do most of the work: journey conversion rate, step drop-off, time to convert and revenue per journey.
- The method has six steps: pick a journey, map it, track it, find the drop, watch the sessions, test a fix.
- Most guides stop at "find the friction". The money sits in the test that comes next.
- Small teams don't need Adobe. One tracking script and a testing tool cover most ecommerce journeys.
What is customer journey analytics?
Customer journey analytics (CJA) is the practice of tracking the steps people take from their first visit to a purchase or signup. It measures where they convert, stall or leave. You see which step breaks and why, so you know what to fix first.
Gartner uses a wider definition. It calls CJA the tracking and analysis of how customers use combinations of channels to interact with an organisation. That suits a bank with branches and a call centre. For an online shop, most of the journey happens on your own site. That's our focus here.
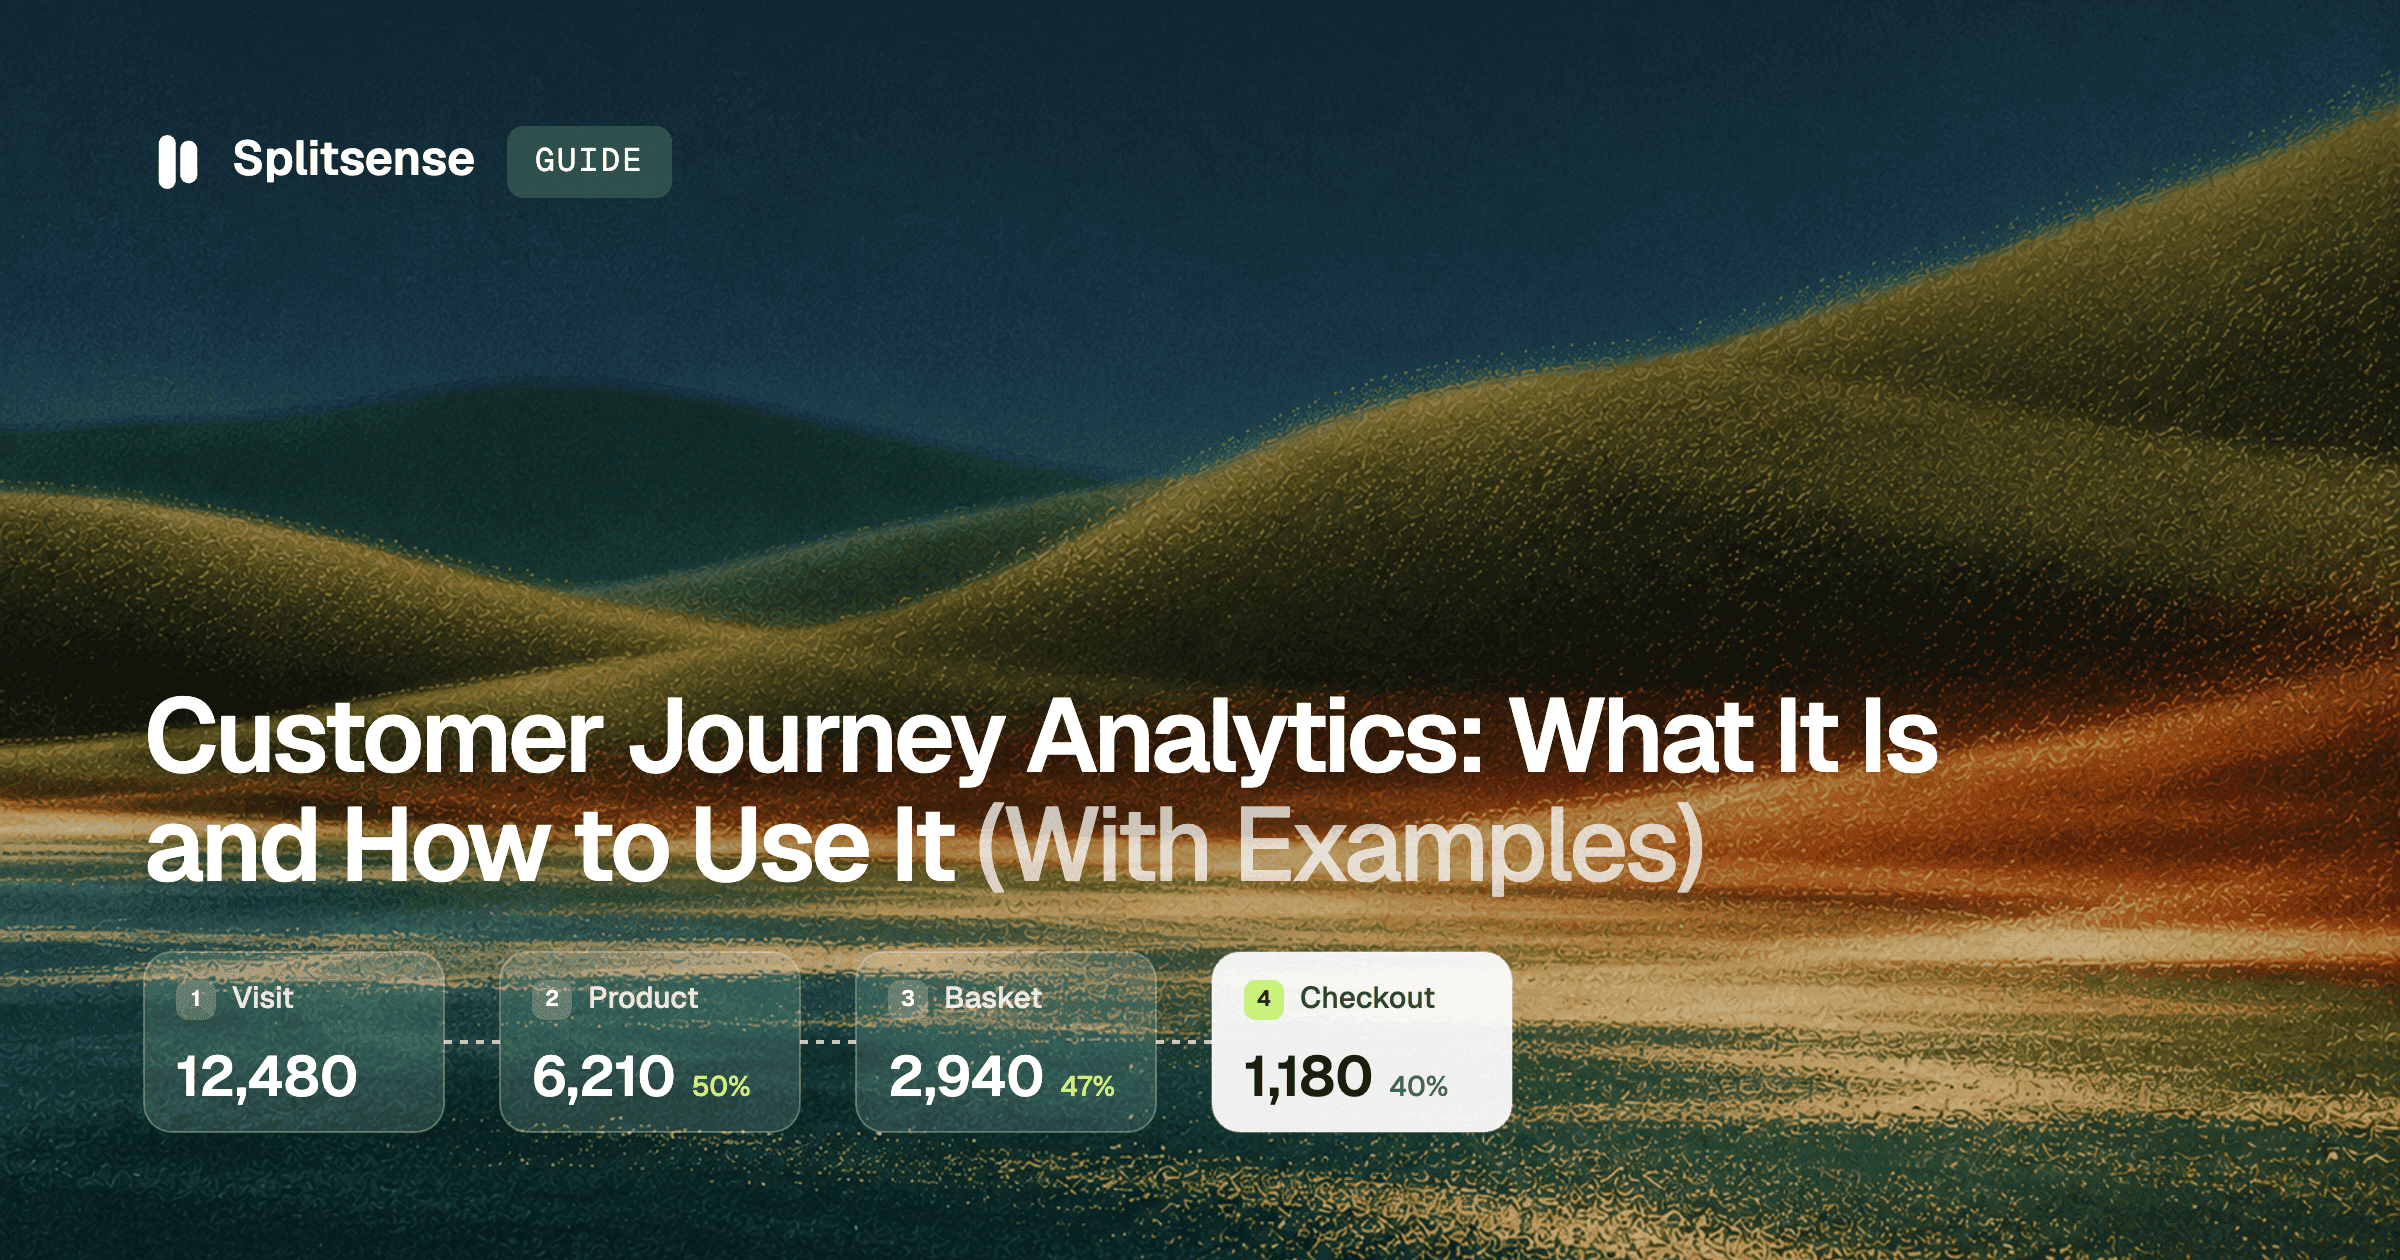
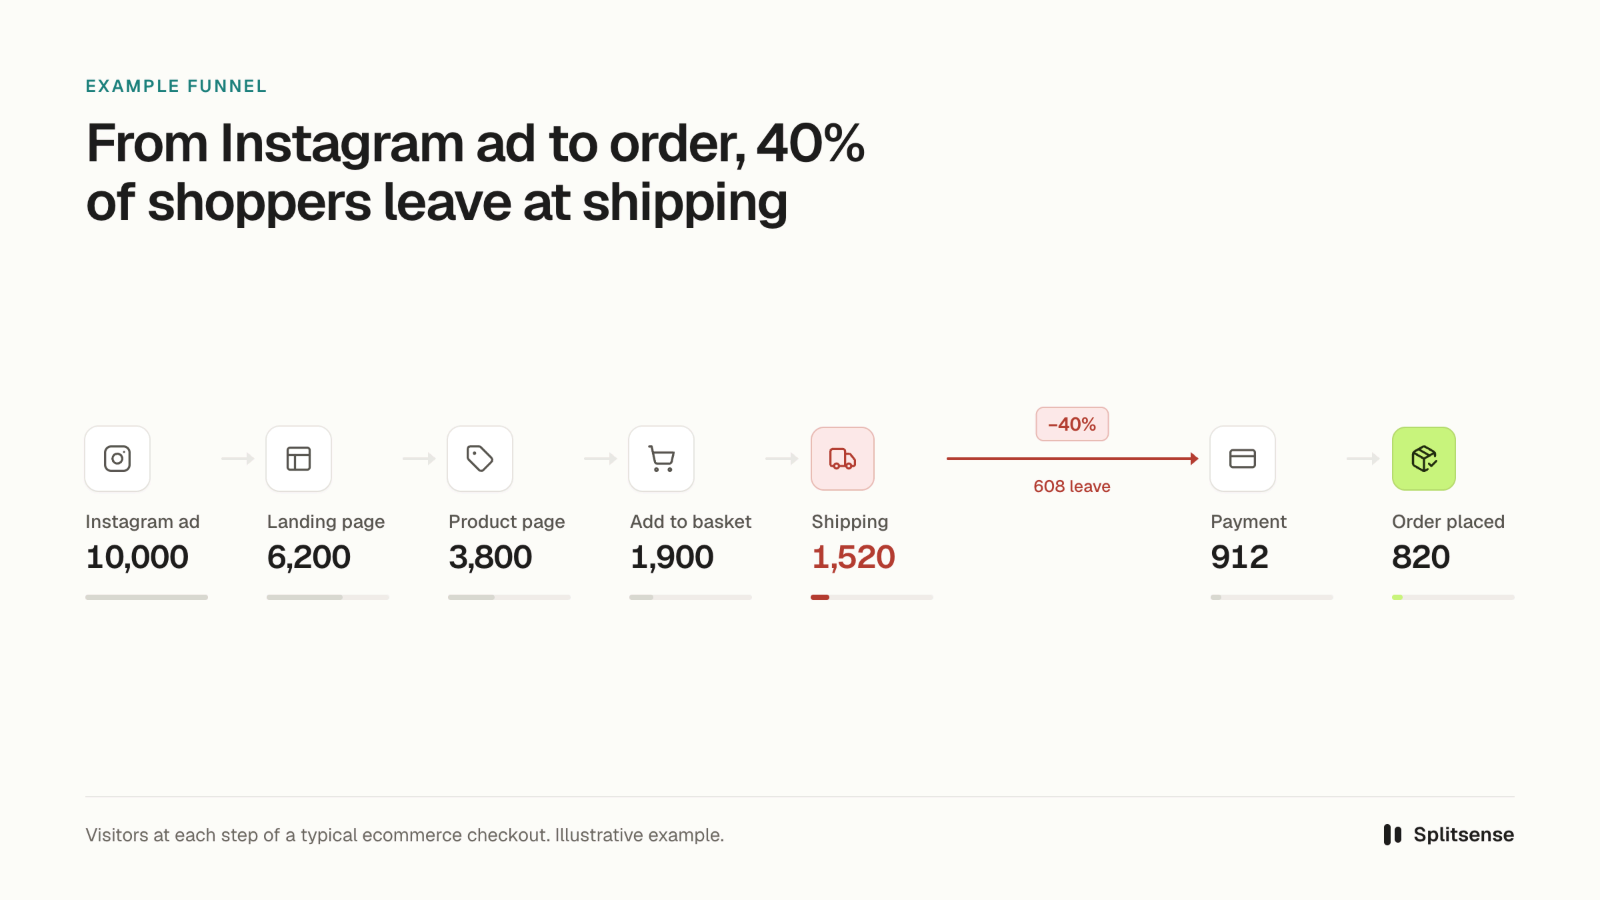
A quick example. A shopper taps an Instagram ad, lands on a product page, adds a jacket to the basket and starts checkout. Now say 40% of shoppers quit at the shipping step. Web analytics shows a dip in sales. Journey analytics points to the step and the people who left there.
Customer journey analytics vs customer journey mapping
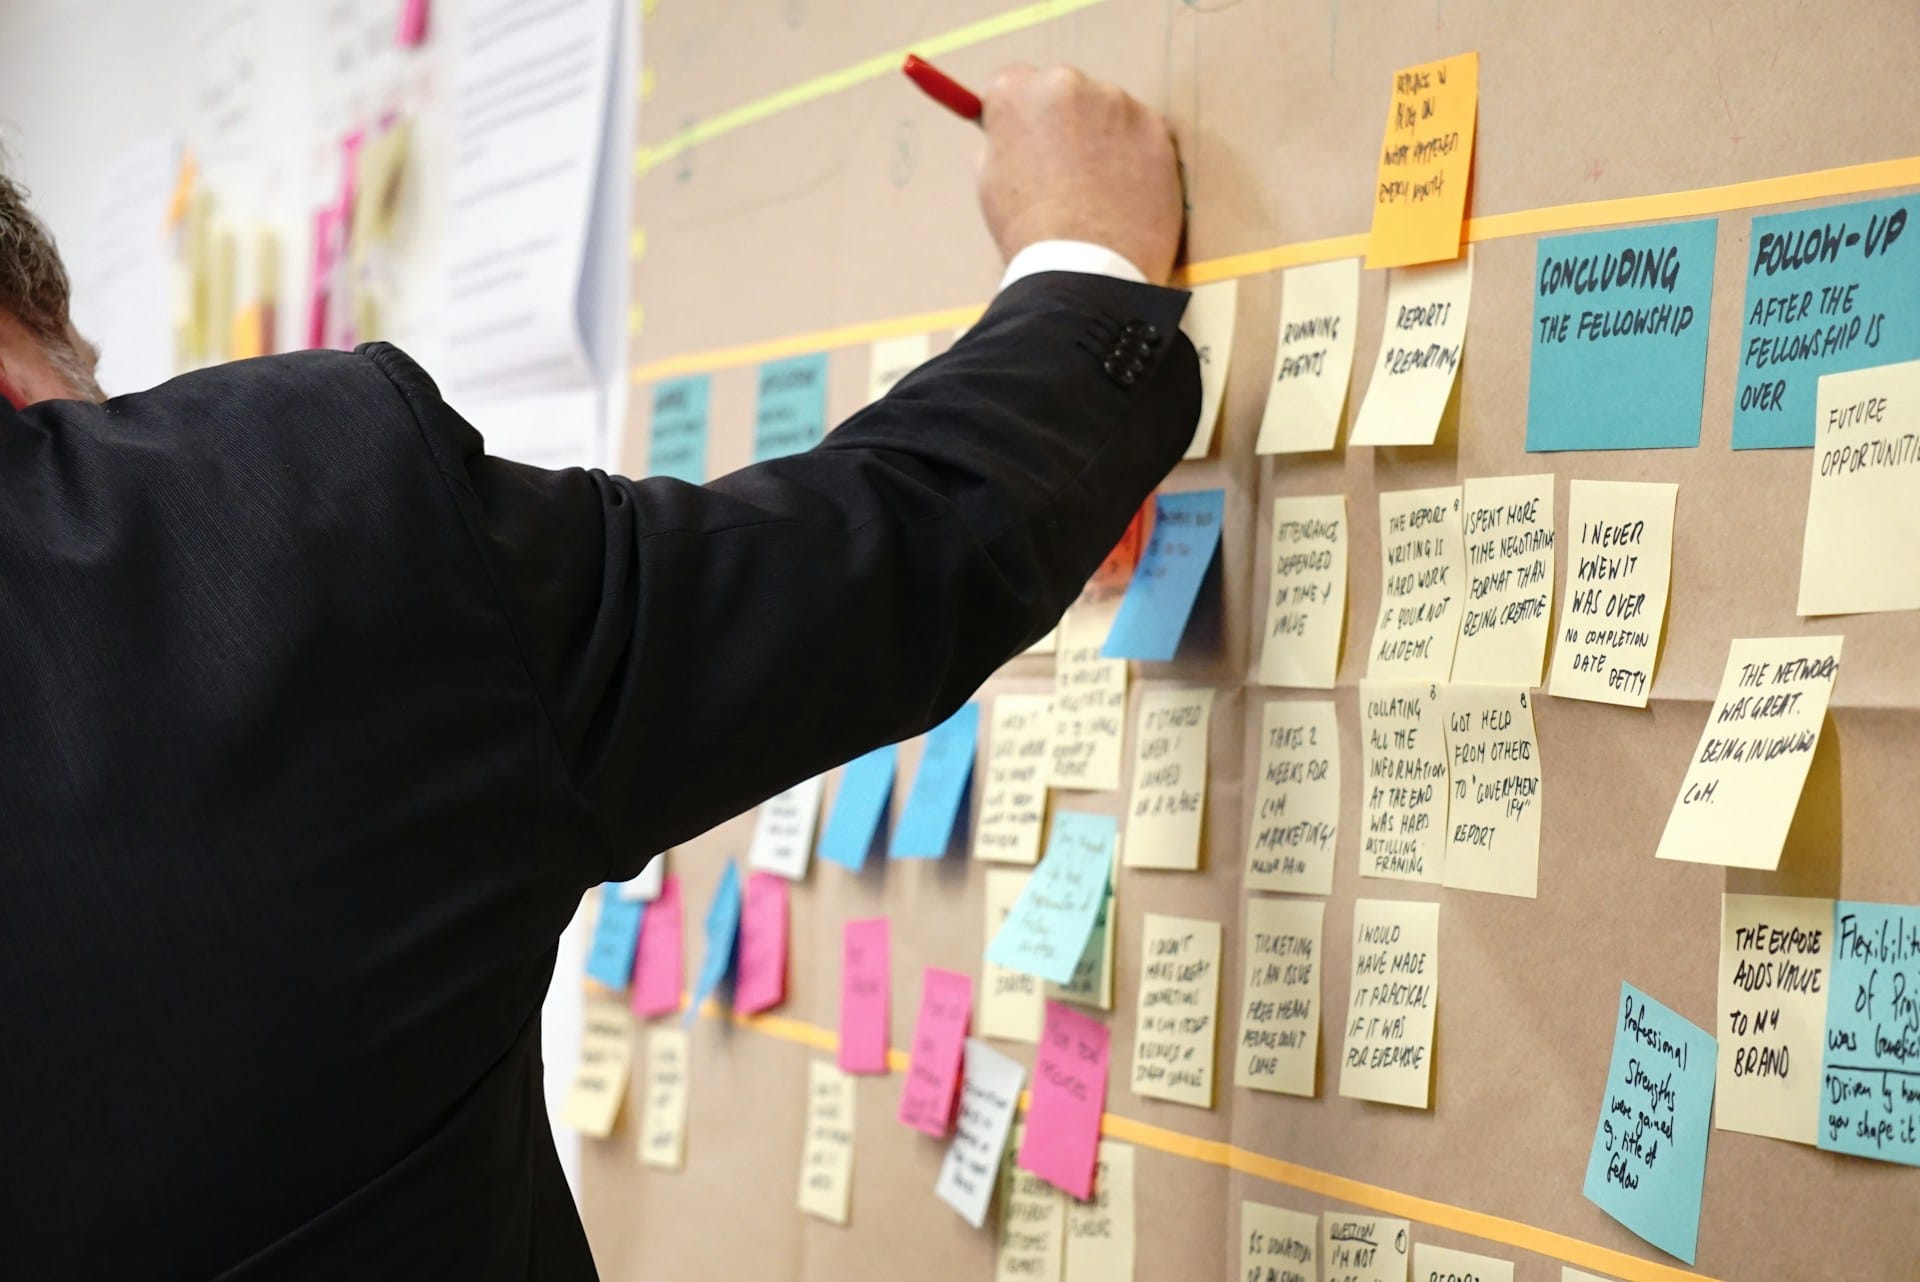
People mix these two up all the time. Nielsen Norman Group defines a journey map as a visualisation of the process a person goes through to reach a goal. Teams build maps from interviews, workshops and plenty of sticky notes. Journey analytics is the data on what people actually did.
Customer journey mapping | Customer journey analytics | |
|---|---|---|
What it is | A picture of the expected journey | Measured behaviour on the real journey |
Built from | Interviews, workshops, surveys | Events, page views, session recordings |
Answers | What do customers think and feel? | Where do they convert, stall or leave? |
Updates | When you rerun the workshop | Every day, from live traffic |
Best for | Aligning the team on the customer's view | Finding and fixing specific leaks |
Use both. Map what you expect. Then check the map against the data. The gaps between the two show you where to start.
Customer journey analytics vs web analytics vs funnel analysis
Each one answers a different question.
Web analytics | Funnel analysis | Customer journey analytics | |
|---|---|---|---|
Question | How much traffic did we get? | How many people finished these fixed steps? | Which paths do people take, and where do they quit? |
Unit | Pages and sessions | One set path, often in one session | Visitors across sessions |
Shows | Visits, sources, bounce rate | Drop-off between set steps | Real paths, loops, exits and time to convert |
Misses | The order of steps | Detours and return visits | Offline touchpoints, in most small-team tools |
Return visits matter more than most reports admit. UK adults spend 4 hours 30 minutes online a day, and 77% of that time is on a smartphone, according to Ofcom. Plenty of shoppers browse on the bus and come back to buy later. A single-session funnel counts that first visit as a loss. Journey analytics links both visits to the same visitor.

Why customer journey analytics matters
Most teams measure touchpoints. The product page converts at one rate, the checkout at another. Each number looks fine on its own. The trouble starts in the gaps between them.
Three McKinsey partners studied this for Harvard Business Review. They found performance on whole journeys was 30 to 40% more strongly correlated with customer satisfaction than performance on single touchpoints. It was 20 to 30% more strongly correlated with revenue, repeat purchases and low churn. One pay-TV provider handled almost every individual interaction well. In key customer segments, satisfaction still fell almost 40% over its new-customer onboarding.
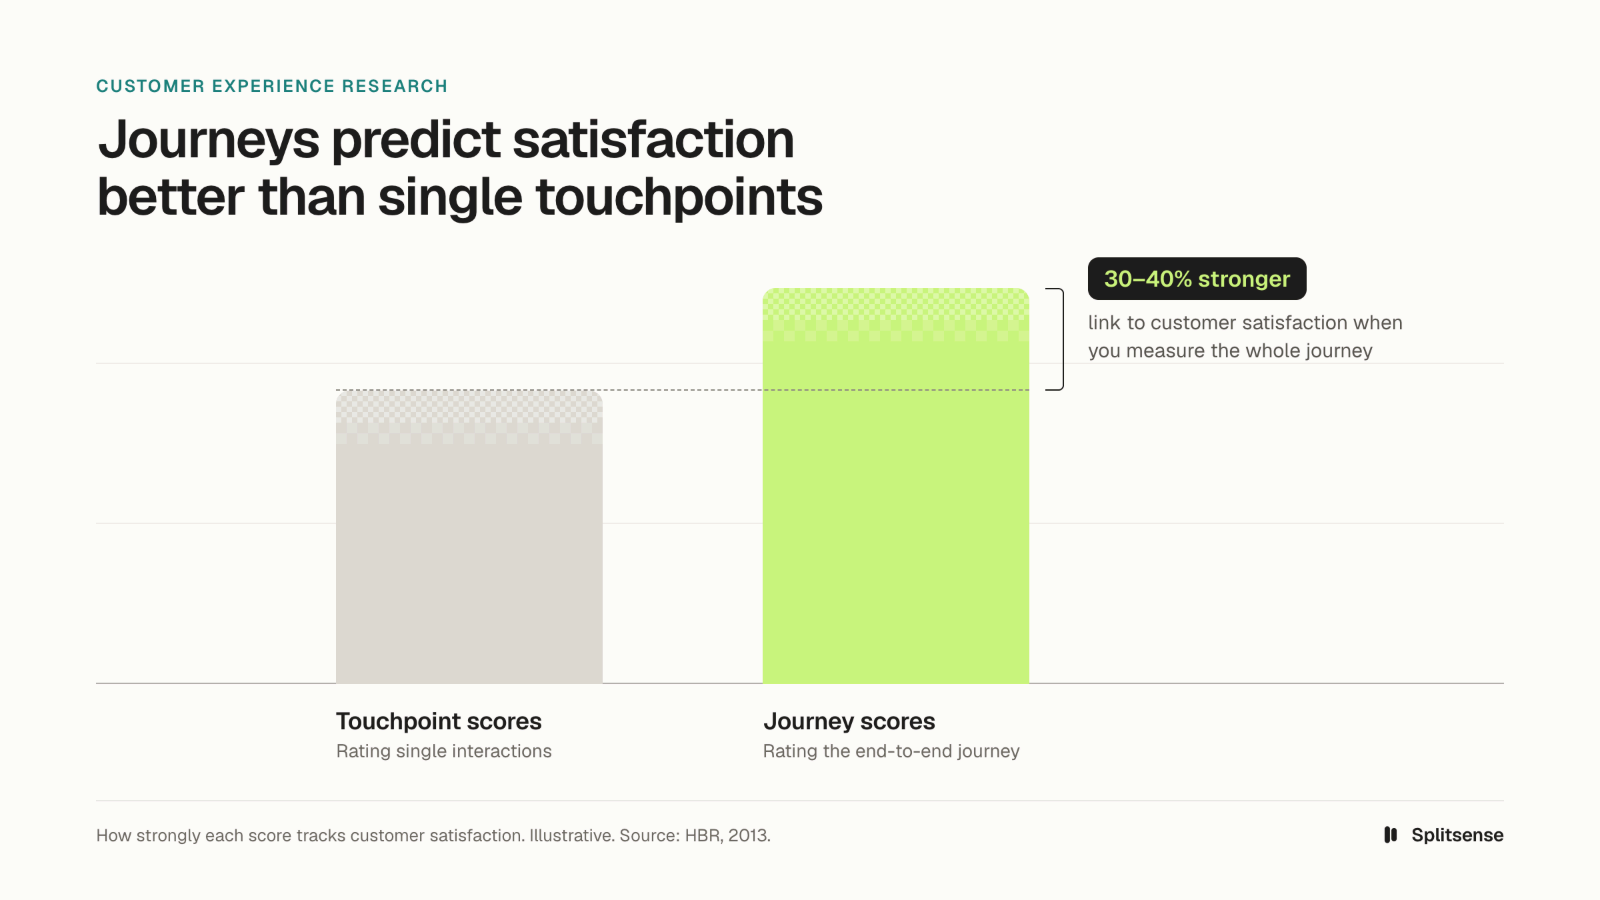
Yes, the study's from 2013 and it's about big service firms. It still applies to your Shopify store. A decent product page plus a decent checkout can still add up to a rubbish purchase.
So what does a small online shop get out of it? Four things.
- You find the actual leak. Not "checkout's a bit weak" but "mobile shoppers bail at shipping twice as often as desktop ones".
- You can rank fixes by the money on the table. Losing 5% on a step 10,000 people reach costs you 500 shoppers. Losing 20% on a step only 300 people see costs you 60.
- You see churn coming. Subscribers who skip two deliveries in a row show up in the data well before they cancel.
- You can prove a change worked, instead of hoping it did. Compare before and after, or better still, run it as an A/B test.
Customer journey analytics metrics that matter
Most guides list journey metrics and skip the maths. Here are eight worth knowing, with formulas and worked numbers. Every example uses the same store, with 30,000 product page visitors a month.
Metric | What it tells you | Formula | Example |
|---|---|---|---|
Journey conversion rate | Share of people who start a journey and finish it | Completions ÷ starts × 100 | 1,200 orders ÷ 30,000 starts = 4% |
Step drop-off rate | Where people quit | (People at step − people at next step) ÷ people at step × 100 | 2,000 reach shipping, 1,300 reach payment = 35% |
Path completion rate | Share who finish the steps in the order you designed | Completions in order ÷ starts × 100 | 900 buyers went straight through = 3% of starts |
Time to convert | How long a purchase takes | Median time from first visit to order | 2 days |
Visits before converting | How many sessions a sale needs | Sessions ÷ converting visitors | 2.6 sessions |
Top exit paths | The last pages people see before they leave | Exits grouped by the final 2 to 3 pages | 22% of checkout exits end on delivery options |
Backtrack rate | How often people go back a step | Backward moves ÷ all step moves × 100 | 15% go from basket back to product page |
Revenue per journey | What each journey start is worth | Revenue ÷ journey starts | £48,000 ÷ 30,000 = £1.60 |
Pick two or three per journey. Tracking all eight on day one buries the signal in noise.
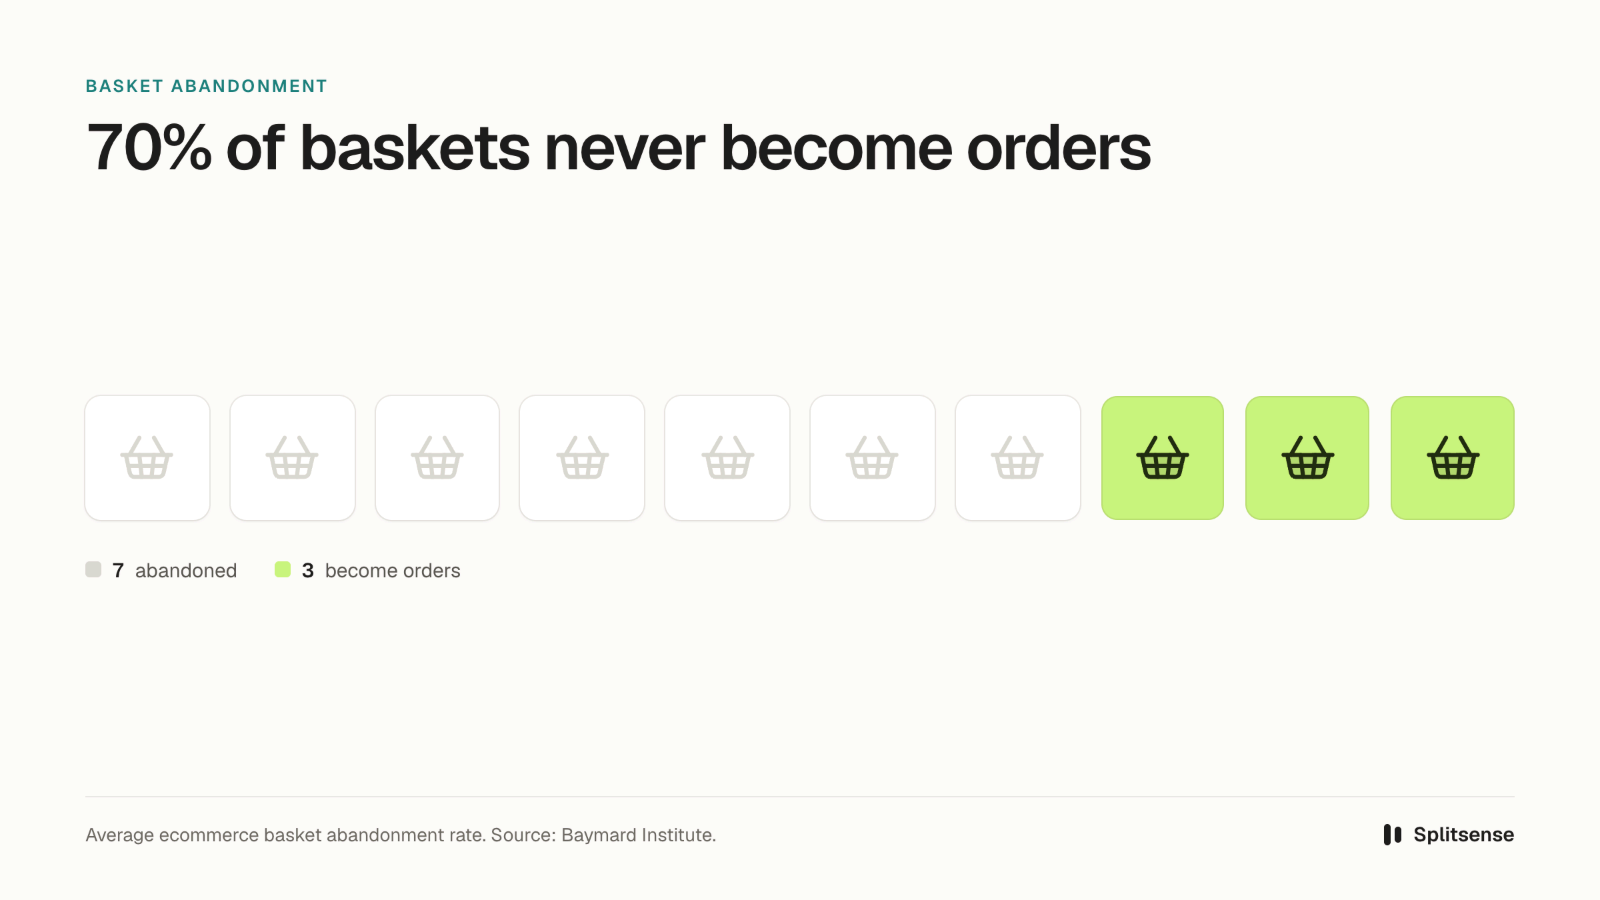
For context on the ecommerce numbers, Baymard Institute puts average cart abandonment at 70.22%, across 50 studies. So seven in ten baskets never turning into orders is normal. The real question is how many of those seven you can win back.
How to do customer journey analytics in 6 steps
How can you track customer journey analytics? Pick one journey, track its steps, find the drop, watch the sessions behind it, then test a fix. Here's each step in more detail.
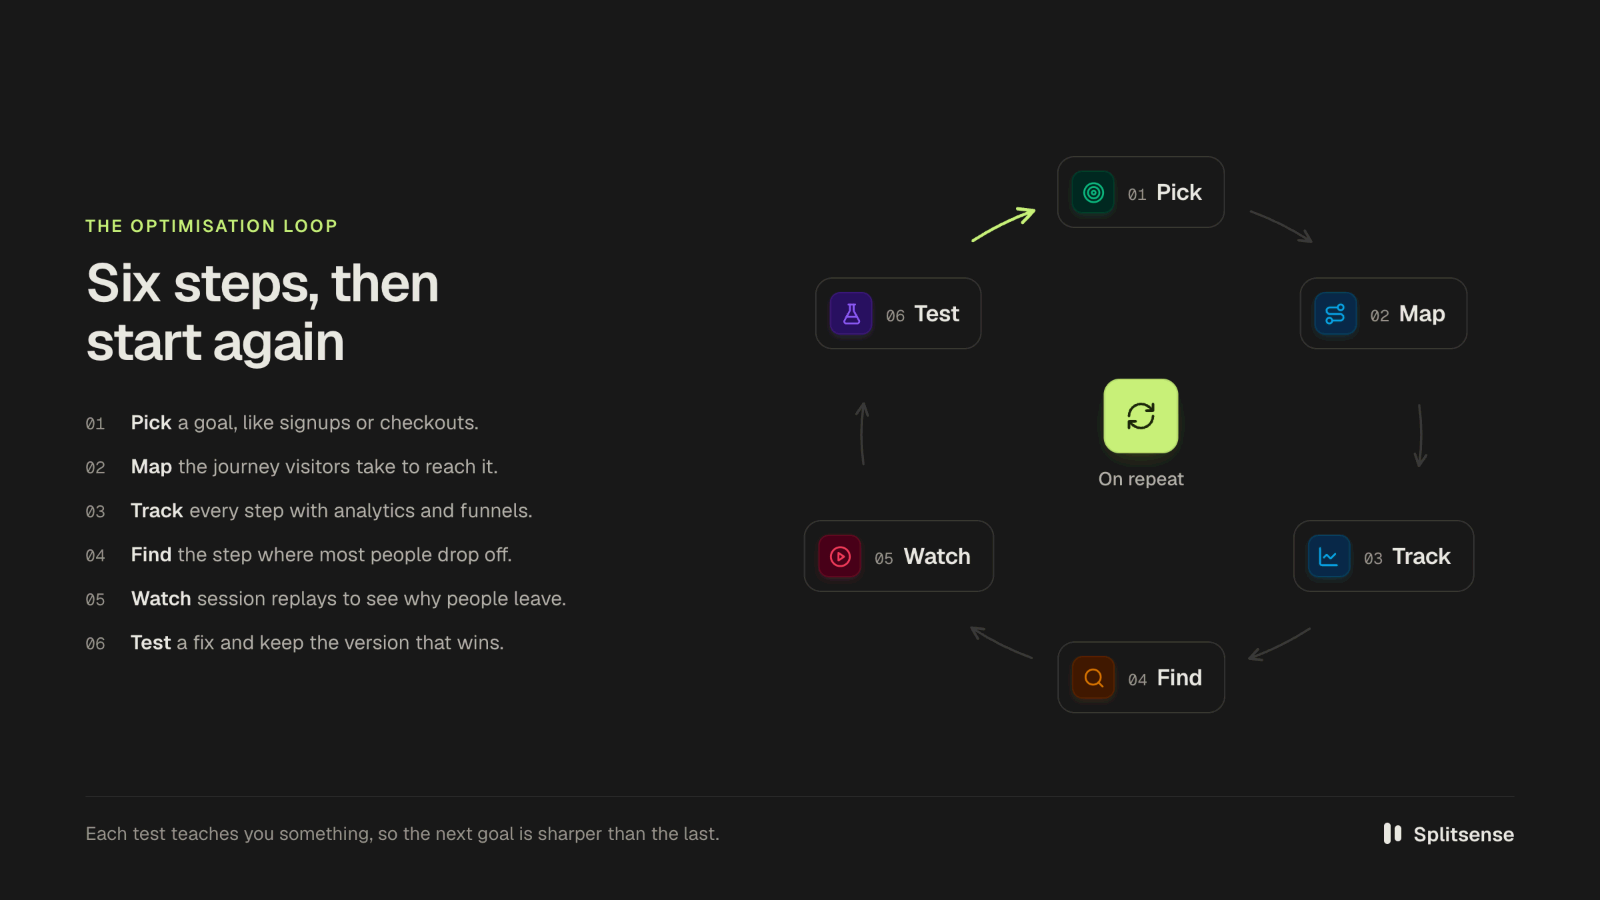
Pick one journey and one goal
Don't start with the whole site. Start with the journey that pays the bills. For most stores that's product page to order. For a subscription brand it's landing page to first box. Write the goal down as one event: order placed, trial started or demo booked.
Map the steps and touchpoints
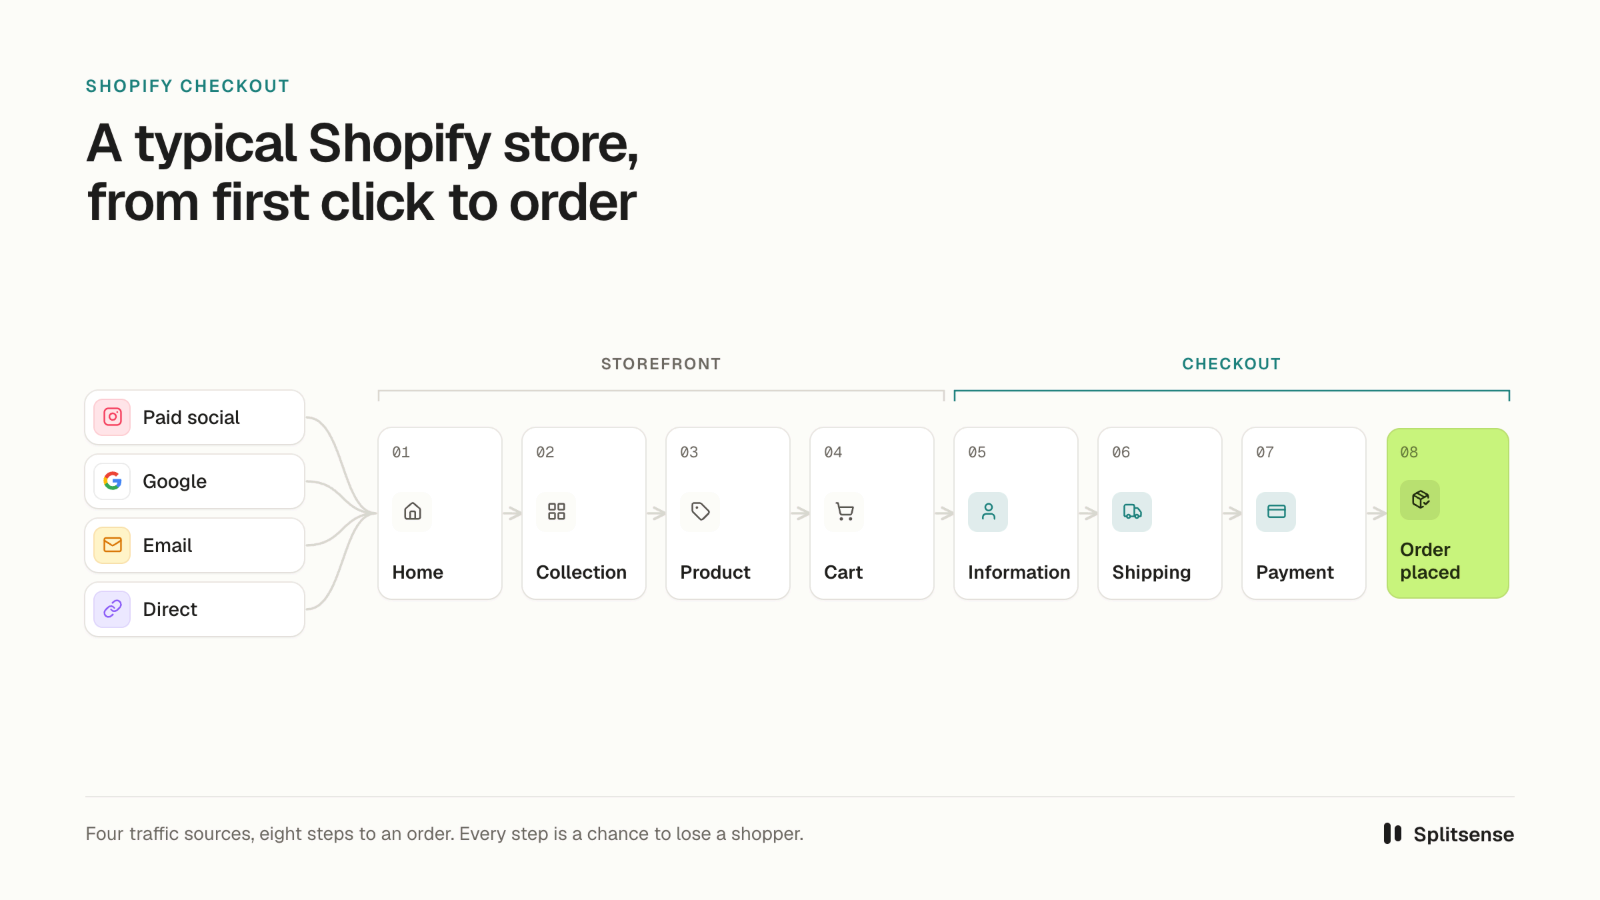
List every step between entry and goal. A typical Shopify store runs entry page, product page, add to basket, basket, checkout contact details, shipping, payment, then order confirmation. Note where people arrive from too: paid social, Google, email or direct. Five to eight steps is plenty.
Track the events
Each step needs an event your tool can count. Page views cover most of them. Add events for the clicks that matter, like add to basket or apply discount code. Tag campaign links with UTM parameters, so you know which ad started each journey.
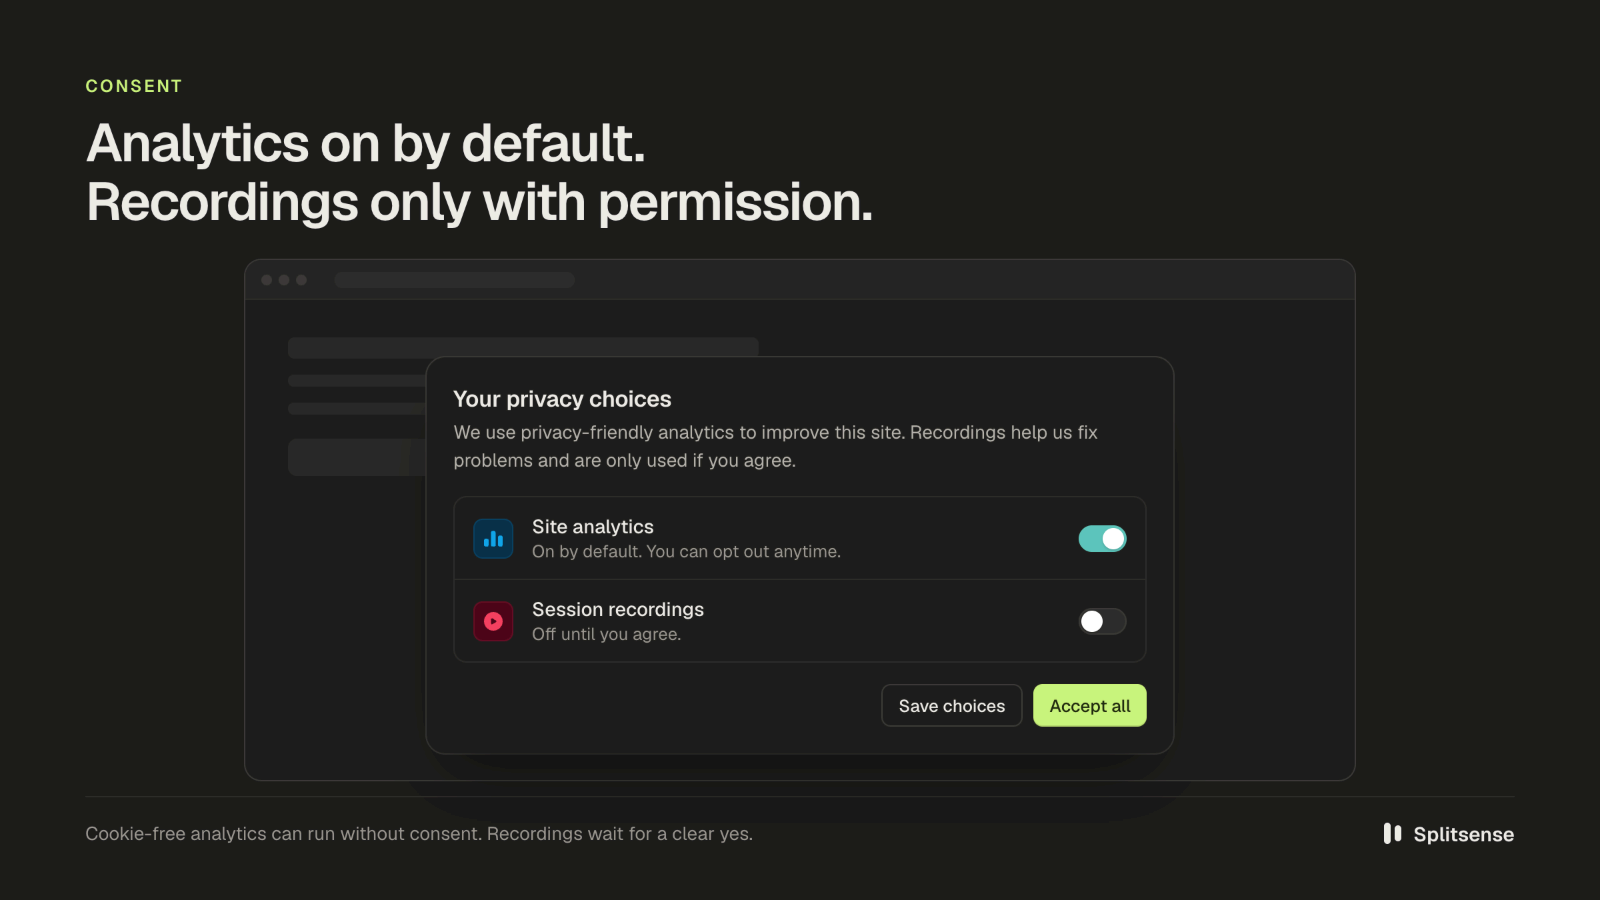
UK sites got a little more room on consent this year. The ICO's guidance, updated in April 2026, lets you run aggregate analytics to improve your own site without consent. You have to tell visitors and give them a simple way to object. A/B testing sits on the ICO's list of activities likely to qualify. Recordings of individual visitors do not, so those still need consent. EU rules are stricter. Check your setup with whoever owns your privacy policy.
Find where people drop
Run a funnel report on your mapped steps. Look for the biggest percentage drop, not the biggest raw number. Then split that step by device, traffic source and new versus returning visitors. A step that loses 20% on desktop and 45% on mobile has a mobile problem, not a checkout problem.
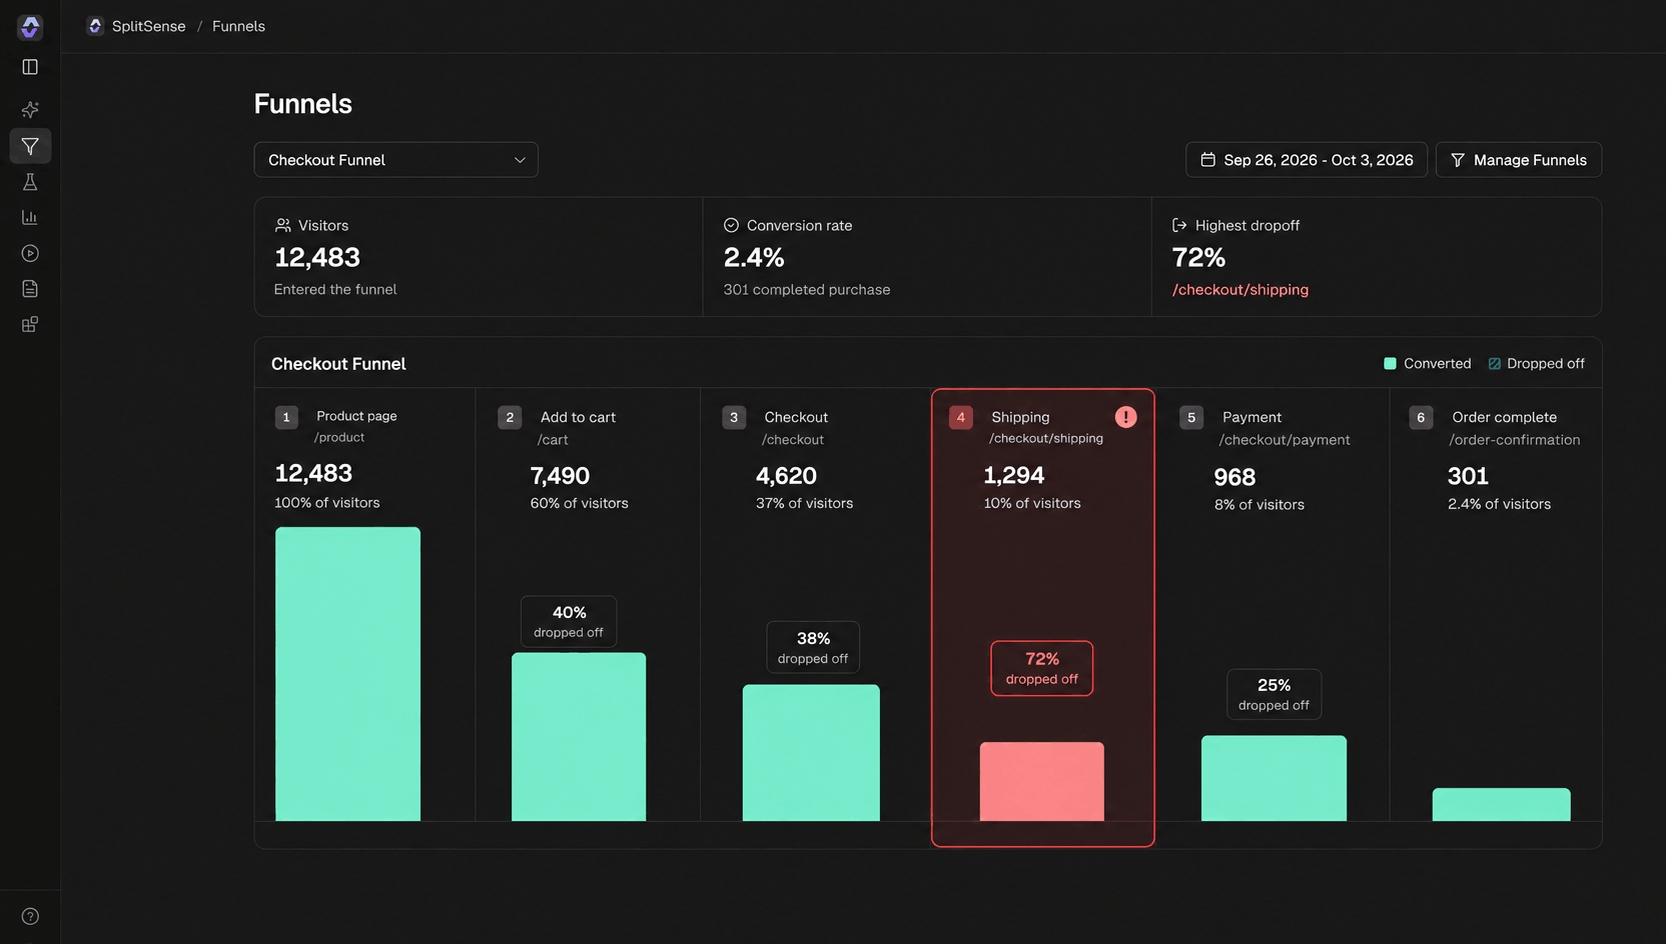
The shipping step loses 35% of shoppers. No other step loses more than 10%.
How do I tell where customers are dropping off?
by u/traderfromKS in shopify
Watch the sessions behind the drop
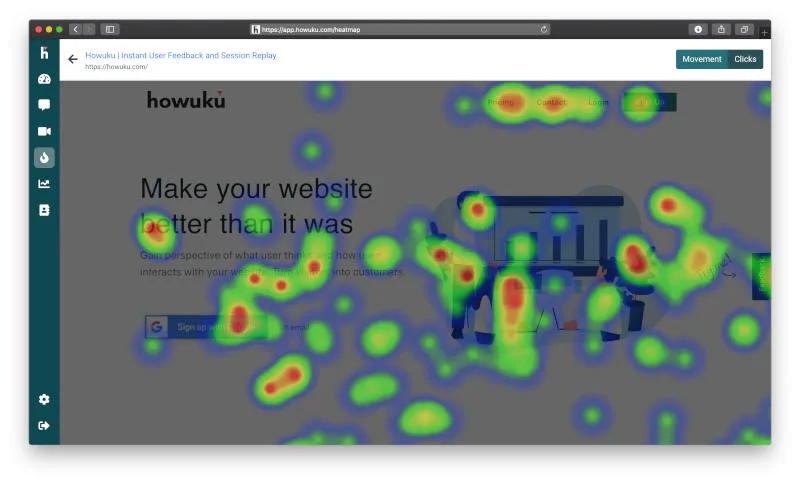
Filter recordings to visitors who reached the drop-off step and left, from the ones who agreed to be recorded. Watch 15 to 20 of them. Patterns appear fast: rage clicks on a dead button, a coupon box that sends people off to hunt for codes, a delivery charge that turns up out of nowhere.
Baymard's survey data matches what most stores find. Leave out the people who were just browsing, and 40% of abandoners blame extra costs like shipping, tax and fees. Another 18% quit over forced account creation, 17% over a long or complicated checkout, and 12% couldn't see the total cost up front.
Turn the finding into a test, then measure it
Most guides skip this step. They stop at "find the friction". Finding it is half the job. Fixing it without a test is a guess.
Ron Kohavi led Microsoft's experimentation platform. His team found that only about one third of the ideas they tested improved the metric they were built to improve. So two in three ideas that looked good on paper did nothing or made things worse. Ship a fix untested, and you won't know which kind you've got.
Write a hypothesis first: "Showing the delivery cost on the product page will cut shipping-step drop-off by 10%." Run it as an A/B test against the current page. Measure journey conversion, not only the step you changed. A fix that moves people through shipping but loses them at payment hasn't helped anyone.
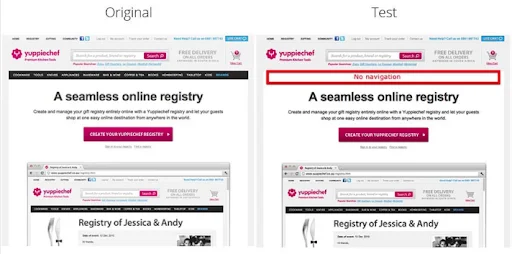
The upside of testing can be large. A Bing engineer tested a small change to how ad headlines displayed. The idea had sat on the backlog for months. Revenue rose 12%, worth over $100 million a year in the US. Your store won't see Bing numbers. The lesson stands though: you can't judge a change by looking at it.
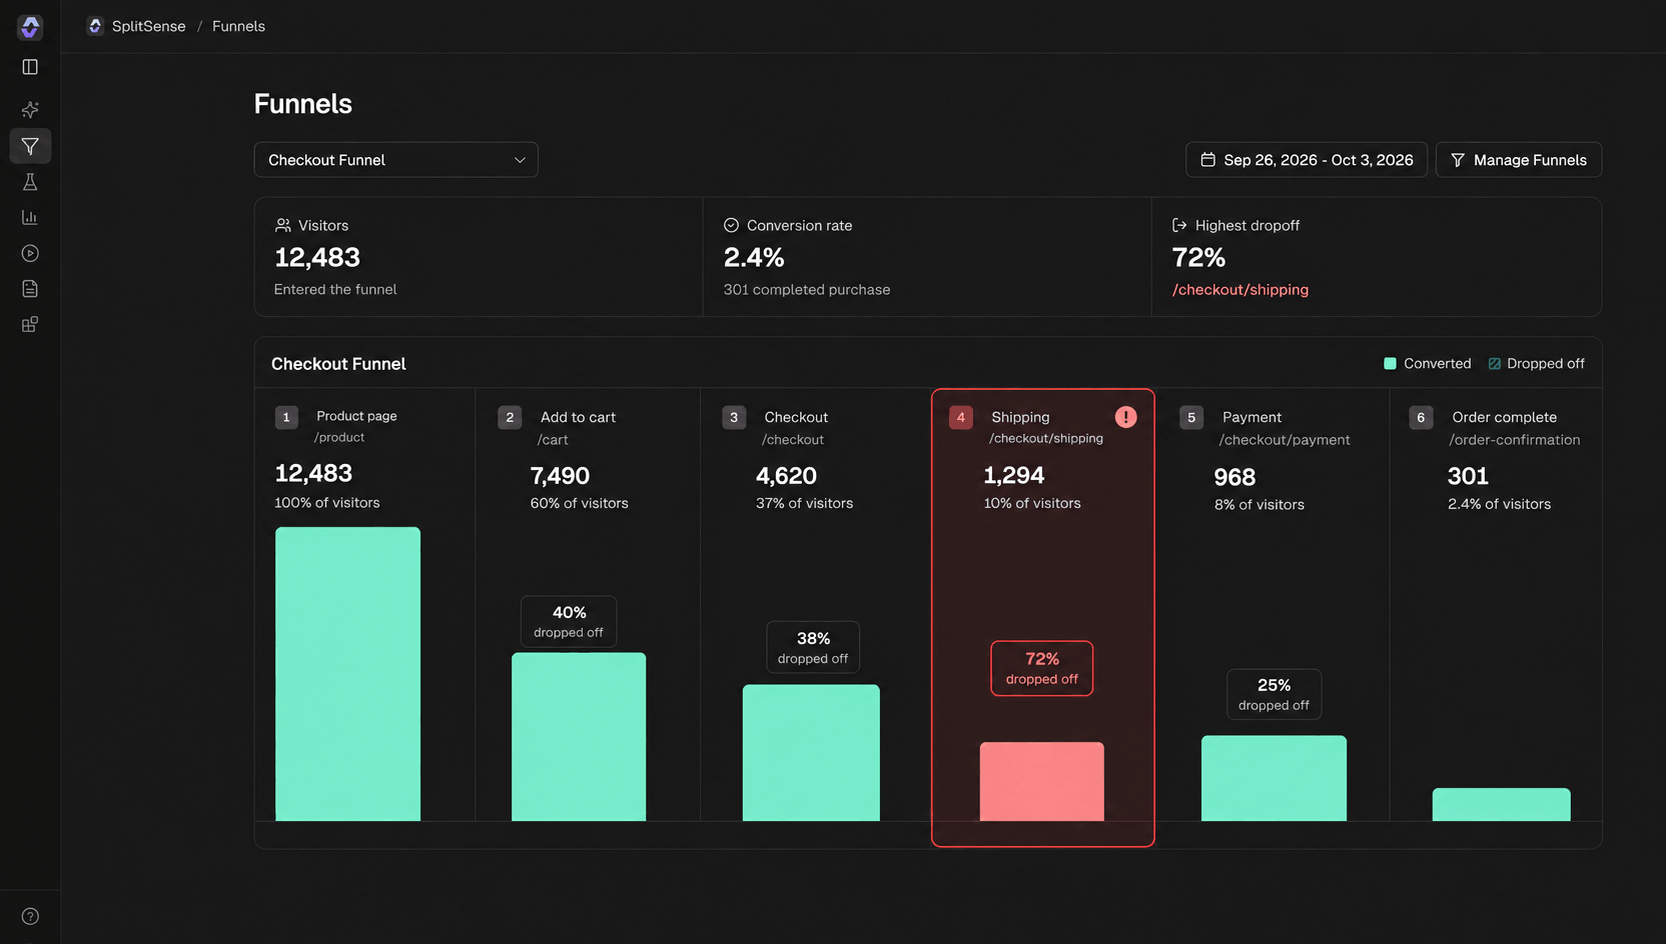
This is the gap SplitSense was built to close. It's customer journey analytics software that runs the test too. It finds the drop, suggests a fix and sets up the experiment, all from one script on your site.
Customer journey analytics examples
Here are three examples, one per business type. The numbers are illustrative. They show how the method works, not results from a named customer.
Ecommerce: surprise shipping costs at checkout
Picture a Shopify homeware store with about 30,000 product page visitors a month. The journey that matters runs from product page to order.
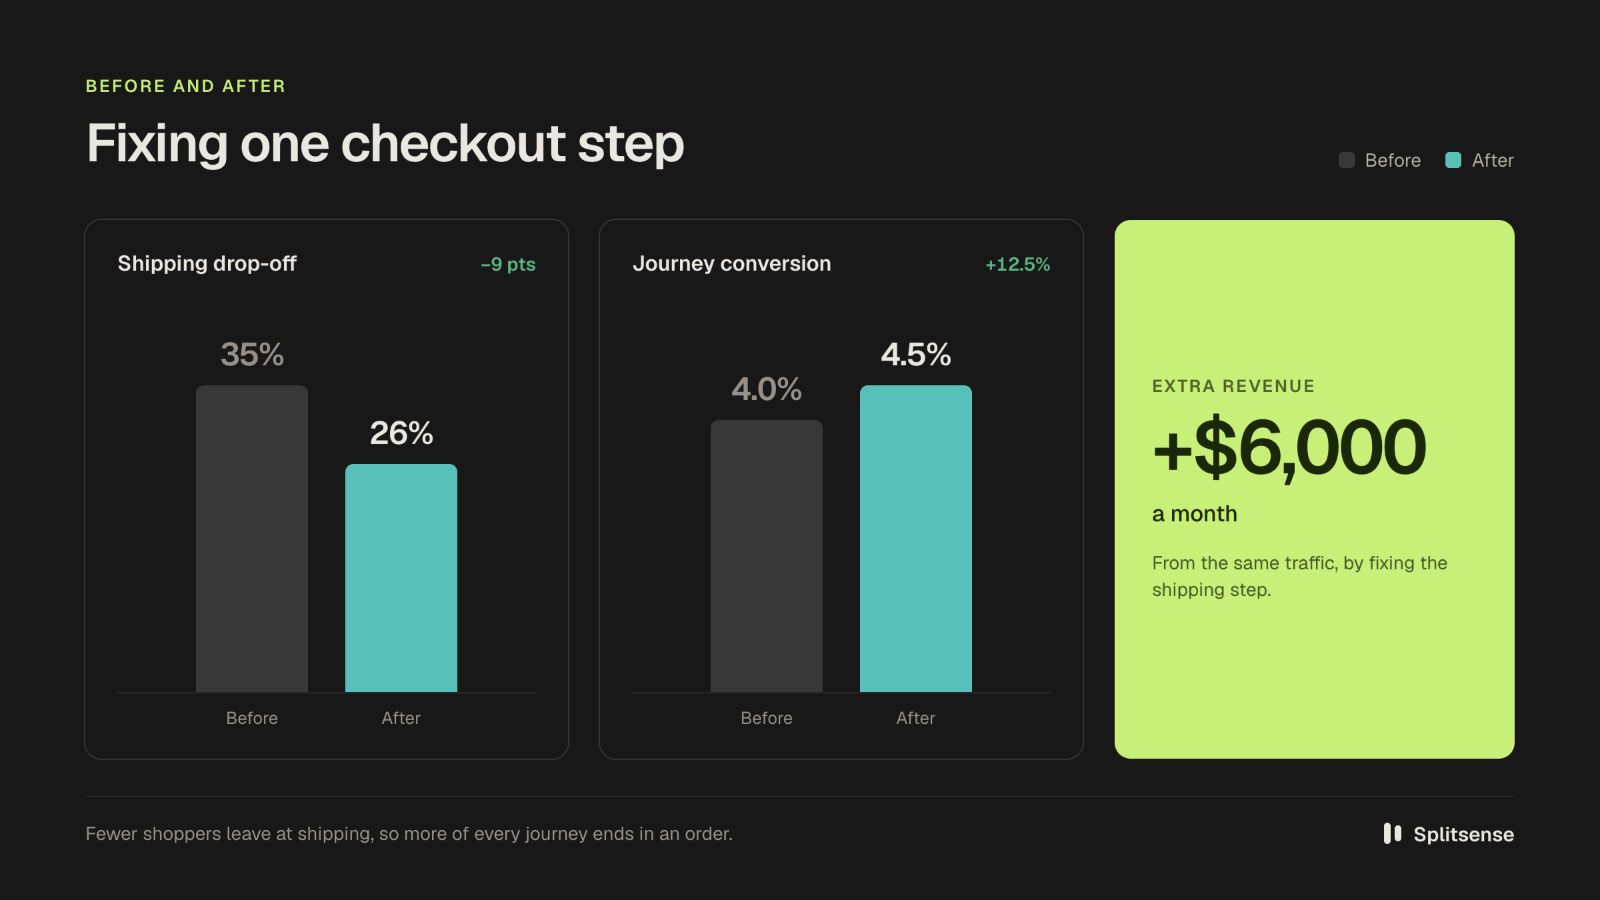
The funnel report shows 2,000 shoppers reaching the shipping step, but only 1,300 making it to payment. That's 35% gone at shipping. Payment, by comparison, loses about 8%.
So you pull up the recordings. Shopper after shopper scrolls the delivery options, stops on the £4.95 standard delivery line and closes the tab. A few head back to the product page, clearly hunting for delivery info they never found.
The fix to test is simple. Put "Free delivery over £50, otherwise £4.95" right under the price on every product page, so nobody gets a nasty surprise later.
Four weeks later, drop-off at shipping is down from 35% to 26%. Journey conversion goes from 4.0% to 4.5%. With a £40 average order, that's roughly 150 extra orders and £6,000 a month you were leaving on the table.
None of this should surprise you. Extra costs are the biggest fixable reason people abandon, per Baymard. If the recordings show people stuck on the form instead, look at checkout length. Baymard found the average US checkout shows 23.48 form elements, when 12 to 14 would do. It reckons big sites can lift conversion by 35.26% from better checkout design alone.
SaaS: trial signup to first value
Now say you run a SaaS product. Here the journey goes from pricing page to trial signup to a first project, ideally inside 7 days.
You get about 900 trials a month. Only 38% create a project in week one, and most of the others stall on the "connect your data" screen.
The recordings tell the story. People open the integrations list, scroll for a bit and leave. Hardly anyone spots the tiny "skip for now" link at the bottom.
Your test: a big "Start with sample data" button at the top of that screen.
Then watch two numbers. First, the share of trials that create a project within 7 days. Then, 30 days on, how many of those people actually pay.
Content and lead gen: organic landing page to demo request
Last one. You've got a guide page that ranks well on Google, and you want it to bring in demo requests.
Search Console says it pulls in 6,000 clicks a month. Demo requests from it? Four.
The scroll data explains it. 70% of readers never get past the second section, and the only call to action sits right at the bottom.
So test a short, on-topic call to action straight after section two.
Measure demo requests per 1,000 organic visits, and give it a few weeks before you call it.
Customer journey analytics tools
Customer journey analytics software falls into four groups. The right pick turns on your team size, your data sources and whether you need offline data. Most customer analytics software for small teams sits in the last three groups.
Tool | Best for | Journey features | Can it test the fix? | Starting price |
|---|---|---|---|---|
Adobe Customer Journey Analytics | Enterprises on Adobe Experience Platform | Cross-channel and offline data, identity stitching | Through Adobe Target, a separate product | Through Adobe sales |
Amplitude | Product teams with event tracking in place | Journeys, funnels, cohorts | Yes, but experiment results need the Growth plan | Free plan (2M events/month), Plus usage-based |
PostHog | Developer-led teams | Funnels, paths, session replay | Yes, built in | Free tier (1M events, 5K recordings/month), then usage-based |
Hotjar | Marketing and UX teams | Heatmaps, recordings, surveys | No | Free plan, Growth from $49/month |
Microsoft Clarity | Teams on a zero budget | Heatmaps, recordings | No | Free |
SplitSense | Ecommerce and SaaS teams with no data team | Funnels, recordings, AI-suggested fixes | Yes, built in | Free tier, paid from $24/month |
Enterprise platforms
This is Adobe Customer Journey Analytics, Salesforce Data Cloud and Qualtrics territory. They pull together web, app, CRM, call-centre and in-store data, and they're built for big retailers, banks and insurers with a data team on hand. Running one website? The setup cost will eat whatever you gain.
Product and behavioural analytics
Amplitude, Mixpanel, Heap and PostHog track events inside a website or app. They're strong on funnels, paths and cohorts. PostHog packs a lot in, but its setup and reports lean towards developers. We compare it in detail in our PostHog comparison.
Session replay and heatmaps
FullStory, Hotjar and Microsoft Clarity show what people did on a page. They're great for the why behind a drop. None of the three runs A/B tests, so you'll need a second tool for the fix. See our FullStory comparison for more.
Analytics plus experimentation
This group finds the leak and tests the fix in one place. SplitSense customer journey analytics runs from one script on any site, with a Shopify integration. It flags the drop, shows the recordings behind it, suggests a fix and runs the A/B test.
How to choose a customer journey analytics tool
Before you book a single demo, be honest with yourself about five things.
- How big your team is. No analyst means you need reports a marketer can read in five minutes.
- Where your journey happens. One website needs one script. Shops, call centres and apps together need an enterprise platform.
- What you can spend. Free tools handle tracking and recordings fine. Testing is usually where the bill starts.
- Whether you need offline data. If you don't, skip the enterprise tier entirely.
- Whether you can act on what you find. A tool that spots the leak but can't test a fix only does half the job.
What about Adobe Customer Journey Analytics?
Adobe Customer Journey Analytics is Adobe's enterprise analytics product, built on Adobe Experience Platform. It combines web, app, call-centre and point-of-sale data in one reporting view. It ranks first on Google for this search too, which explains a lot of the confusion.
To use it, your company needs an Adobe Analytics contract with the CJA add-on, or a standalone CJA licence. Adobe Experience Platform has to be provisioned for your account as well. Adobe doesn't publish prices. You buy it through its sales team.
It suits large retailers, banks and telecoms with offline data, a data team and an existing Adobe stack. A Shopify store with three staff ends up paying for cross-channel plumbing it never uses.
Common customer journey analytics challenges
The first thing that trips people up is data spread across too many tools. Don't try to stitch it all together on day one. Pick one journey and one tool that tracks it end to end, then bring in email and ad data once the basics work.
Next up, device switching. Most UK time online happens on phones, so plenty of journeys start on a phone and finish on a laptop. Logged-in accounts can link those sessions, but cross-device tracking needs the visitor's consent. Don't chase perfect identity early on.
The sneaky one is drowning in reports and doing nothing with them. Run one journey, one metric and one test at a time. A finished test beats ten dashboards nobody reads properly.

Last, consent. Aggregate analytics on your own site can run under the UK's statistical purposes exception. Session recordings can't, so they need consent. Keep the two separate in your cookie banner and you've dodged the most common trap.
Customer journey analytics FAQs
What is CJA?
It's short for customer journey analytics. You track the steps people take from first visit to purchase or signup, then look at where they convert, stall or leave. That tells you which step to fix first. Adobe sells a product with the same name, which is where most of the confusion comes from.
What is customer journey analytics software?
Customer journey analytics software collects events from your site, joins them into paths for each visitor and reports where people drop off. Small-team tools run from a single script. Enterprise platforms like Adobe CJA join web, app, CRM and in-store data, and need a data team to run them.
What is the best customer journey analytics tool?
Honestly, it's whichever one fits your team and your data. Big companies with offline data go for Adobe CJA or Salesforce. Product teams like Amplitude or Mixpanel. If you're a small ecommerce or SaaS team, you'll get the most from something that tracks the journey and tests the fix in one place. That's what we built SplitSense for.
How can you track customer journey analytics?
Pick one journey and one goal. Map the steps, then track each step as an event, with UTM tags on campaign links. Run a funnel report to find the biggest drop. Watch session recordings at that step. Then test a fix with an A/B test and measure journey conversion.
How is customer journey analytics different from web analytics?
Web analytics counts traffic: visits, pages, sources and bounce rate. Customer journey analytics follows each visitor through a sequence of steps, across sessions. It shows the order of actions, where people loop back and where they quit. Web analytics tells you sales fell. Journey analytics tells you which step broke.
Do small businesses need customer journey analytics?
Yes, for any business that sells online. A small store faces the same 70% average cart abandonment as a large one, per Baymard. Free tools cover the basics, and the method needs no data team. One journey, one funnel report and a few recordings are enough to find the first fix.
Is Adobe Customer Journey Analytics the same thing?
No. Adobe Customer Journey Analytics is one enterprise product. Customer journey analytics is the practice. You can do it with Adobe, with free tools, or with something like SplitSense. Adobe's version makes sense if you've got offline data and already pay Adobe.
Start with one journey this week
Pick the journey that pays the bills. Find the step that loses the most people. Watch 20 recordings of them leaving. Then test one fix and measure the whole journey, not one page.
That's the whole method. Splitsense runs every step of it from one script.
Sources
- Baymard Institute, 50 Cart Abandonment Rate Statistics, updated 22 Sep 2025
- Rawson, Duncan and Jones, The Truth About Customer Experience, Harvard Business Review, Sep 2013
- Kohavi, Crook and Longbotham, Online Experimentation at Microsoft, 2009
- Kohavi and Thomke, The Surprising Power of Online Experiments, Harvard Business Review, Sep to Oct 2017
- Ofcom, Online Nation 2025, Dec 2025
- ICO, What are the exceptions?, Apr 2026
- Nielsen Norman Group, Journey Mapping 101, reviewed Jul 2026
- CMSWire, Gartner Report Highlights Emerging Customer Journey Analytics Market
- Adobe, Customer Journey Analytics overview